
Scientific Visualization with the Wolfram Language |
Maintained by Jeff Bryant |
| Intro | 2D Graphics | 3D Graphics | Hybrid Graphics | Animations |
Related Links
- Wolfram|Alpha
- The Wolfram Demonstrations Project
- Wolfram Functions Site
- MathWorld
- Wolfram Research
- Mathematica
- gridMathematica
- Mathgroup
- Mathematica Information Center
- Mathematica Yahoo Group
My Other Pages
| Previous 3D Graphic | Next 3D Graphic |
10,000 Earthquakes |
  |
Static Version | Interactive Version
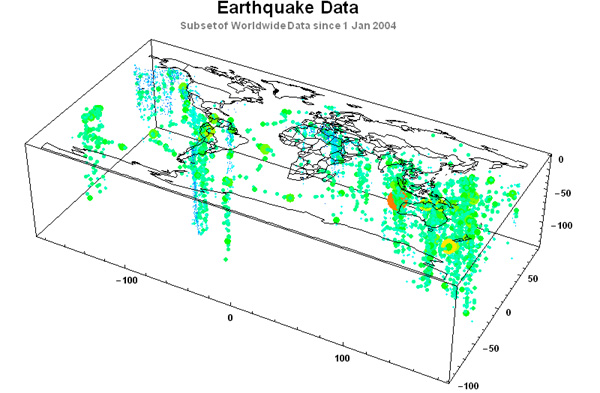
Mathematica generated animation showing 10,000 earthquakes created by Jeff Bryant (jeffb@wolfram.com). Additional contributions by Oyvind Tafjord and Joshua Martell.