
Scientific Visualization with the Wolfram Language |
Maintained by Jeff Bryant |
| Intro | 2D Graphics | 3D Graphics | Hybrid Graphics | Animations |
Related Links
- Wolfram|Alpha
- The Wolfram Demonstrations Project
- Wolfram Functions Site
- MathWorld
- Wolfram Research
- Mathematica
- gridMathematica
- Mathgroup
- Mathematica Information Center
- Mathematica Yahoo Group
My Other Pages
| Previous 2D Graphic | Next 2D Graphic |
Riemann Zeta Function |

|
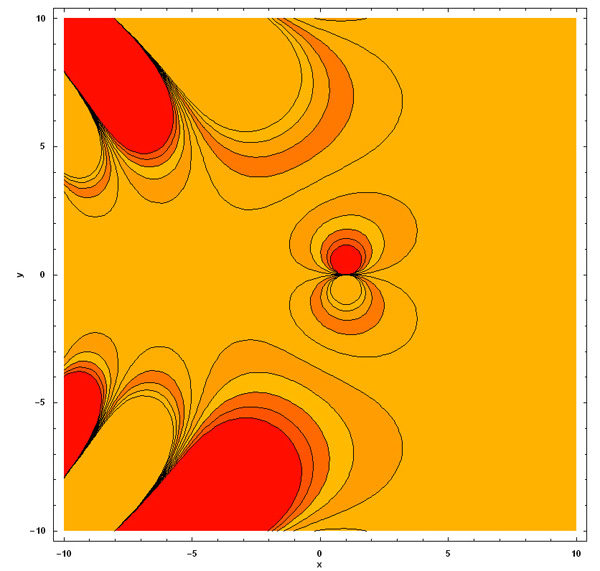
Mathematica generated ContourPlot of the Riemann Zeta function in the complex plane created by Jeff Bryant (jeffb@wolfram.com)