Stars constantly struggle to balance gravity and pressure
throughout their lives. Main sequence stars fuse hydrogen in their
cores in order to maintain this balance. For a main sequence star
with a chemical composition similar to the Sun, the relationship
between radius and effective surface temperature (in Kelvin) can be
modeled fairly easily.
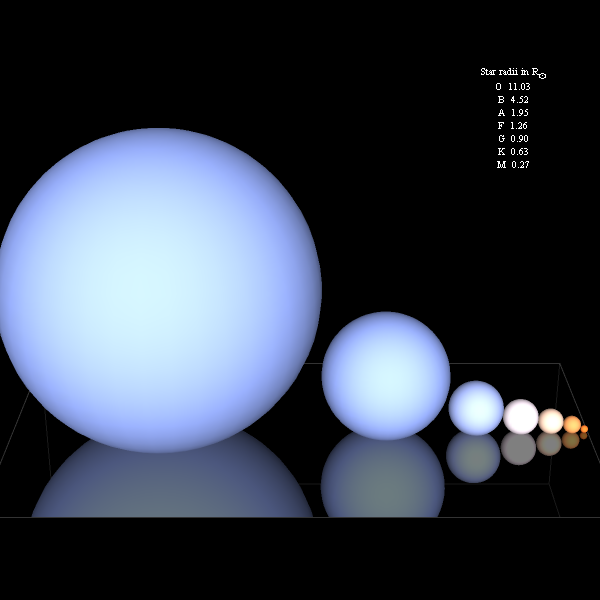
This graphic presents this simple case by imagining that the
various spectral classes of stars, OBAFGKM, are laid out on a shiny
table next to each other for comparison. If you change the
temperature of a star, its color and radius (measured in terms of
the Sun's radius) also change. The hottest stars, the O and B
stars, are always blue. At the other end of the spectral class
range, the color changes become more evident. Created by Jeff Bryant
(jeffb@wolfram.com)
|
