Stochastic Nonlinear Oscillator (CERN)

| Previous 2D Graphic | Next 2D Graphic |
Stochastic Nonlinear Oscillator (CERN) |
|
When studying, e.g, particle tracking data it is often difficult to analyse a plot of a particle trajectory in phase space when it is presented statically as a collection of dots. In this graphic created by John Jowett and Krzysztof Goral at CERN, the colours of the dots contain information about the time-evolution of the system. Typically, the points progressively change colour (actually their hue) from red at the beginning of the trajectory to violet at the end.
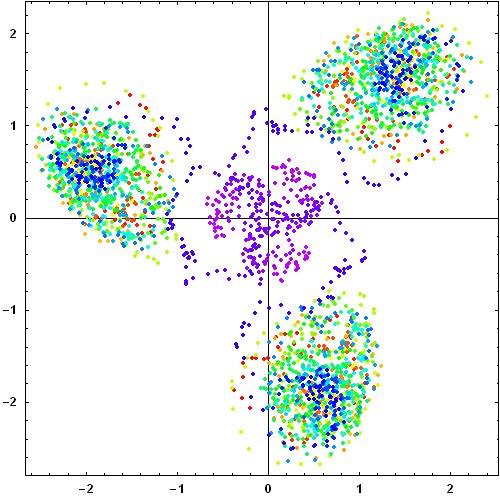
Mathematica generated image showing a stochastic nonlinear oscillator created by Krzysztof Goral and John M. Jowett (CERN).