| Previous 2D Graphic | Next 2D Graphic |
Voronoi Diagrams |
Interact with this |
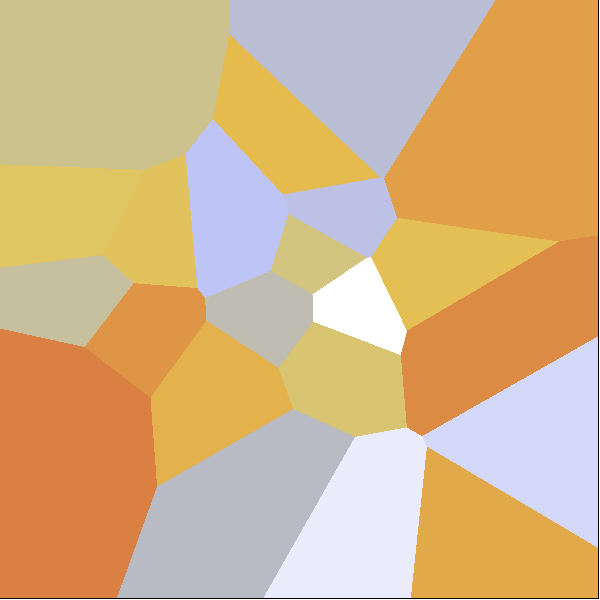
Create a bunch of seed points in a plane. Now, define all the regions in which all other points are closer to those seed points than to all other seed points. The result is a Voronoi diagram. Created by Jeff Bryant (jeffb@wolfram.com)